
In case you haven’t heard, there’s a general election coming up here in the UK. This has caused a spike in the number of analysis I’m seeing from social media companies, a large number of them containing some horrific “sins against data science”. Here are a few of my favourites:
1. Thinking Social Media Matters.
Unless you are actually studying social media, i.e. your findings relate strictly to social media and you are not trying to project your insights onto the general population as a whole, then social media doesn’t matter a jot. It doesn’t matter because it is not a statistically significant sample. Your social media sample is, at least “doubly self selecting”.
Firstly, it’s self selecting because it only includes that part of the population who use social media. Secondly, it’s self selecting because even amongst people on social media, your sample only contains those people who are talking about the subject you are interested in. Thus, when trying to gain insight into what the general population think about a particular subject, social media alone is useless.
This sin manifests itself in headlines such as “65% of people think UKIP will be a positive influence in government”. To be accurate, this headline would have to be rewritten as, “A proportion of the population of the UK are on social media and of those, a proportion are talking about the election. We took a statistically insignificant sample of those people and analysed their posts. Of those posts 65% of them indicated a belief that UKIP will be a positive influence in government.“ Somehow, this isn’t as catchy a headline.
2. Thinking Size Matters
I was recently speaking at a conference and I got into a conversation with an attendee that went something like this… “I see you and I are doing the same kind of analysis, my analysis doesn’t agree with yours and since I have two orders of magnitude more data than you, you should stop saying the stuff you’re saying and agree with me.”
Being the polite and mild mannered chap that I am, I explained that I drew my data from the Twitter stream API which guarantees me a statistically significant sample of all of the tweets generated (even then it’s not perfect). So, when I say “12% of tweets show such and such”, I can say that with confidence, even though I’m not looking at all tweets, because I have a statistical sample.
The chap talking to me however, also takes tweets from the same feed, and from other feeds and from selected people who he deems to be “subject matter experts” and collects all that data into one large Bucket-O-Crap.
In short, he started with a statistically correct sample, then diluted down until the sample was worthless. He was fixated on the fact that his sample size was two orders of magnitude larger than mine, but lost sight of the fact that what he now had was garbage.
3. Using Concrete Numbers in Findings
This brings me on nicely to my next “sin”, and that is the use of concrete numbers in findings. I see lots of blog posts that say “x number of tweets were tagged #VoteMuppetParty”. No they weren’t. That is how many was in your sample, unless you forked out for the Firehose feed that number is nowhere near a reflection of how many tweets were actually posted.
What you can, legitimately say is that “30% of tweets were tagged #SuchAndSuch whilst 40% were tagged #ThisAndThat”. You can do this because your sample is statistically correct, so the ratios will be (near enough) the same in your sample as in the whole Twitter population.
“Wait a minute!” I hear you say, “I’ve read your blog, Gary and you do that, you use concrete numbers in this chart”:
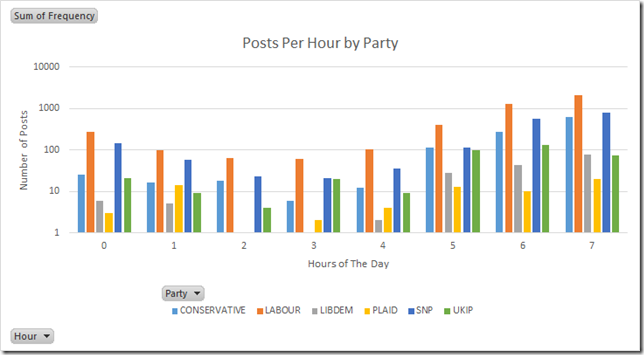
It’s true, I do. Here I use concrete numbers because the difference between the number of posts per hour for the highest and lowest performing parties, means I have to use a logarithmic scale on the Y axis in order to show all the data. The first time I used this chart, I took trouble to explain that the numbers were there to show orders of magnitude differences only, and should not be taken as a concrete value.
4. Averaging Ordinal Data
This is my pet hate and you see it everywhere (even the BBC). So what do I mean by this. Well, let’s say we had a class of pupils all taking a test out of 100. We can count up their scores and divide by the number of pupils to get an average score for the test. We can do this because the data is numeric and so the difference between 1 and 2 is the same as the difference between 8 and 9.
Not so with ordinal data. Ordinal data implies some form of rank, but the difference between each point on the scale is not the same, nor is it the same for each person question. For example, if I say rate something between 1 and 5 where 1 is terrible and 5 is great, each person questioned has to divide the numbers between 1 and 5 and attach their own value to it. These will vary from person to person.
Even if I breakdown each of the numbers and attach a value myself, each person questioned will have a different idea of what each means. For example if I say, rate this from 1 to 5 where 1 is very bad, 2 is bad, 3 is neither good nor bad, 4 is good and 5 is very good; each person will have their own idea of what the difference between good and very good is. When dealing with numerical data, everyone knows the difference between 3 and 4 and it is the same for everyone.
For these reasons you cannot average ordinal data. Stop doing it!!
The easy way to remember it, is not to let the numeric part fool you. Instead just use the word values you attached to the numbers. Now answer me this, what is the average of “Good” and “Very good”? It’s meaningless, right? Right! Well so is the difference between 4 and 5 on an ordinal scale.
Well that’s it for this post, if you are doing social media analysis, please make sure you don’t “sin against data science” and until next time, keep crunching those numbers! ![]()

I give this post a 4.2.
Lol, nice one.
>